How Monte Carlo retirement simulation works

Link accounts read-only, run a 1,000-path Monte Carlo, and try the no-signup demo — then backtest the plan against every market since 1928.

01Connect

Every account, one read-only view.

Link your brokerages and crypto in a couple of clicks. Killion connects through SnapTrade with read-only access — we can see balances to model them, never move a dollar. Your holdings refresh on their own, so the picture stays current without a spreadsheet.

  • Brokerages via SnapTrade — strictly read-only
  • Cash and bank balances you enter and update yourself
  • Crypto and manual assets, all in one place
Killion account-connection screen showing brokerage and crypto links being added read-only.
02See where you stand

Your whole financial life, on one dashboard.

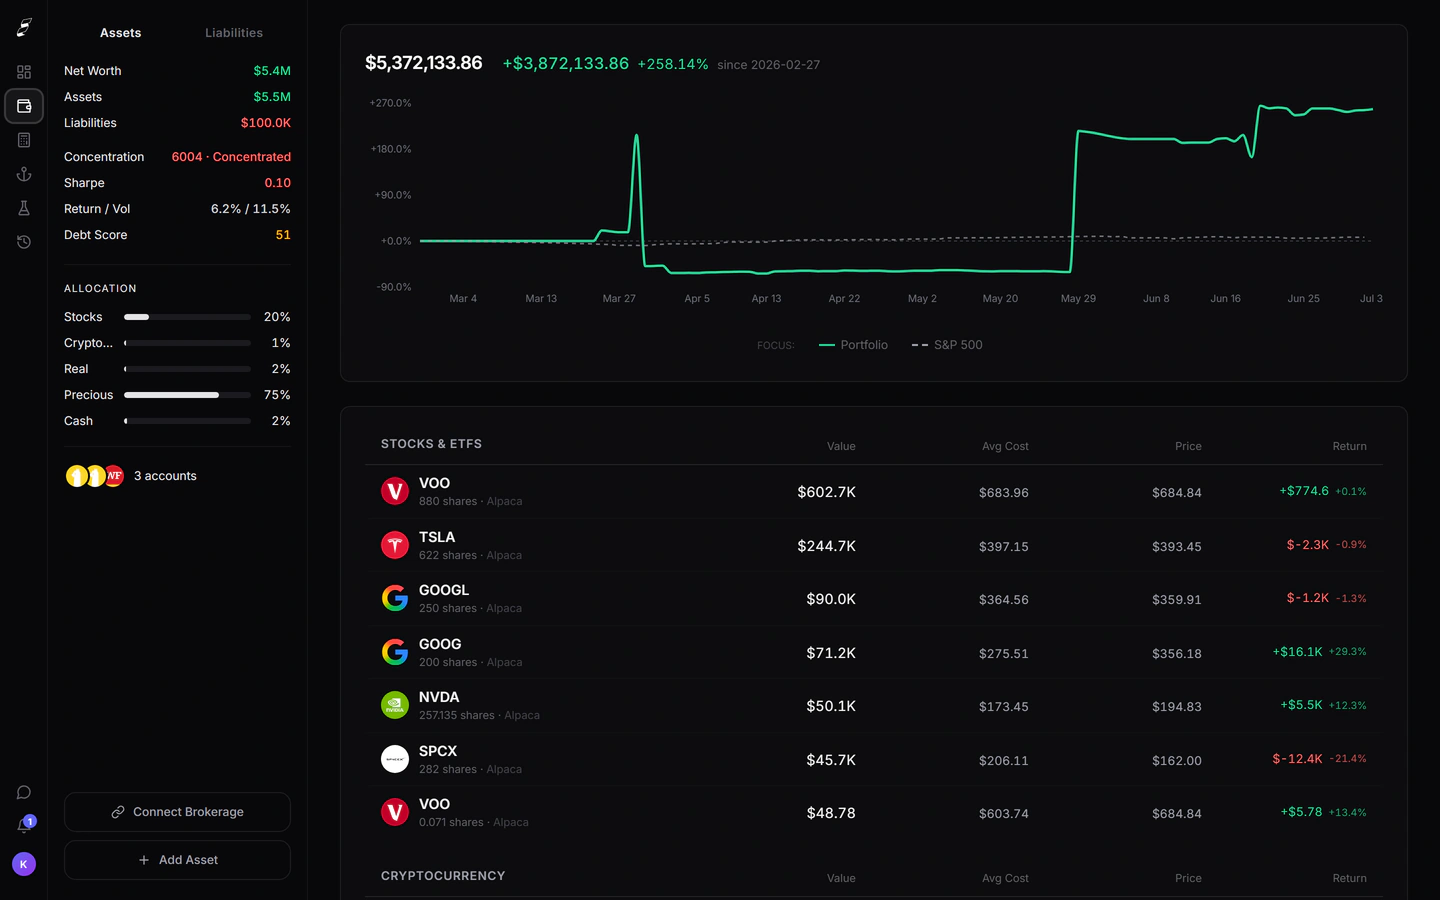
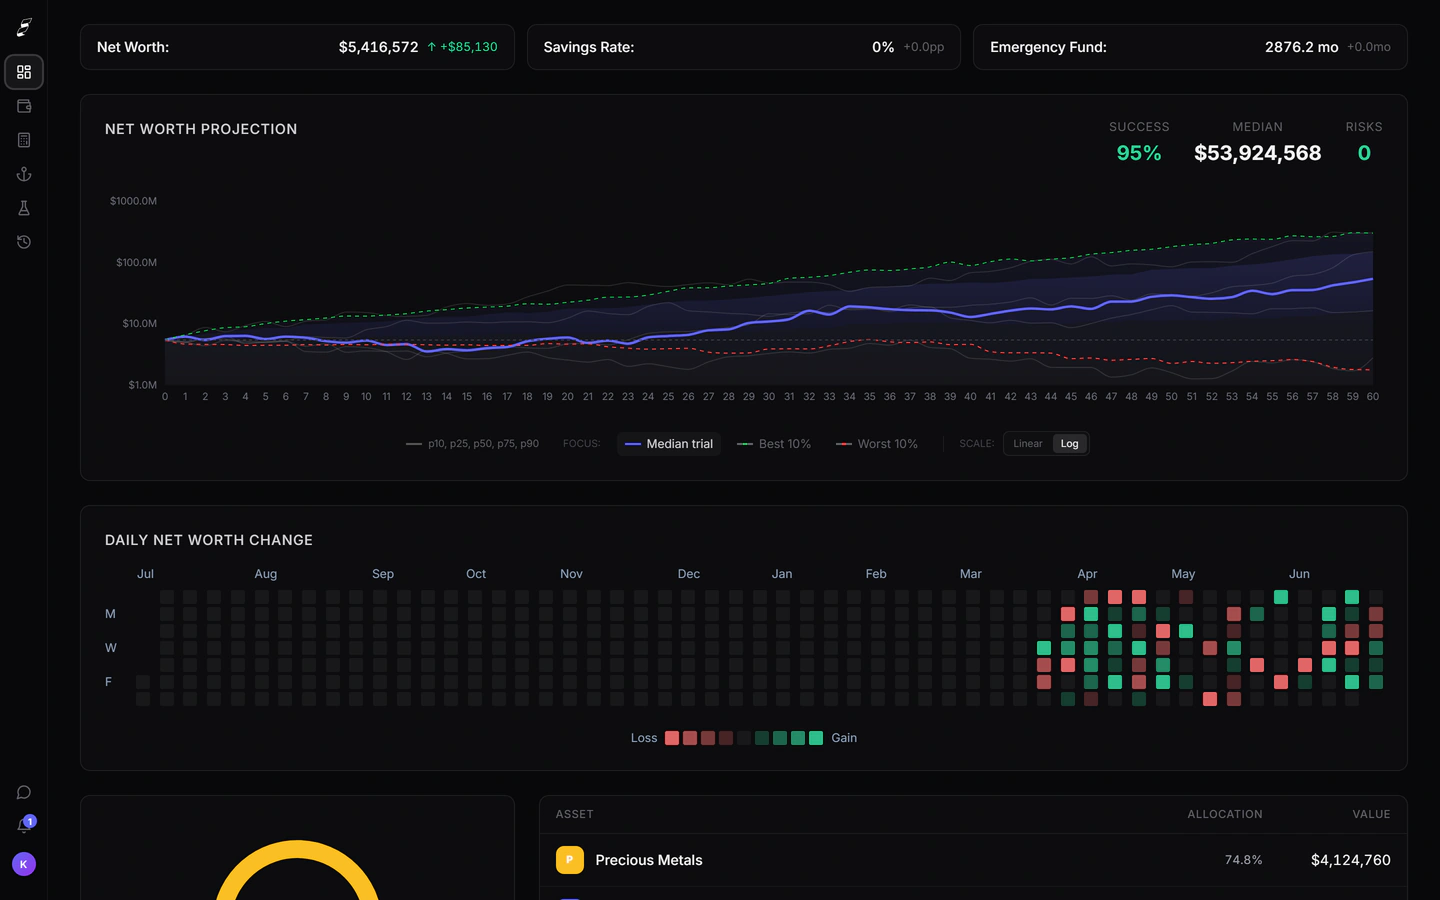
Net worth over time on a log scale, so decades of compounding read as a clear line instead of a flat start. An allocation chart that ties every slice back to the holding behind it, live market prices — precious metals valued at today’s price, not what you paid — and a Current Finances tab that itemizes every asset and liability, one click to the details.

  • Net-worth history, including connected balances
  • Allocation by category, updated live
  • Assets and liabilities, fully itemized
Killion dashboard showing net-worth history on a log scale and a live asset-allocation chart.
03Ask Killion

An AI copilot that already knows your numbers.

A chat rail sits beside every screen — and it’s wired into your real data. It reads your net worth, cash flow, allocation, and your latest simulation, so its answers are about you, not a generic FAQ. Pull a live stock price with a cited source, pressure-test a recession, or just name a fear: “Am I OK if I lose my job?”

  • Grounded in your live balance sheet, cash flow, and projections
  • Pulls live market data and cites its sources
  • Bring it the anxious questions, not just the quant ones
04Simulate the future

Not one guess — a thousand futures.

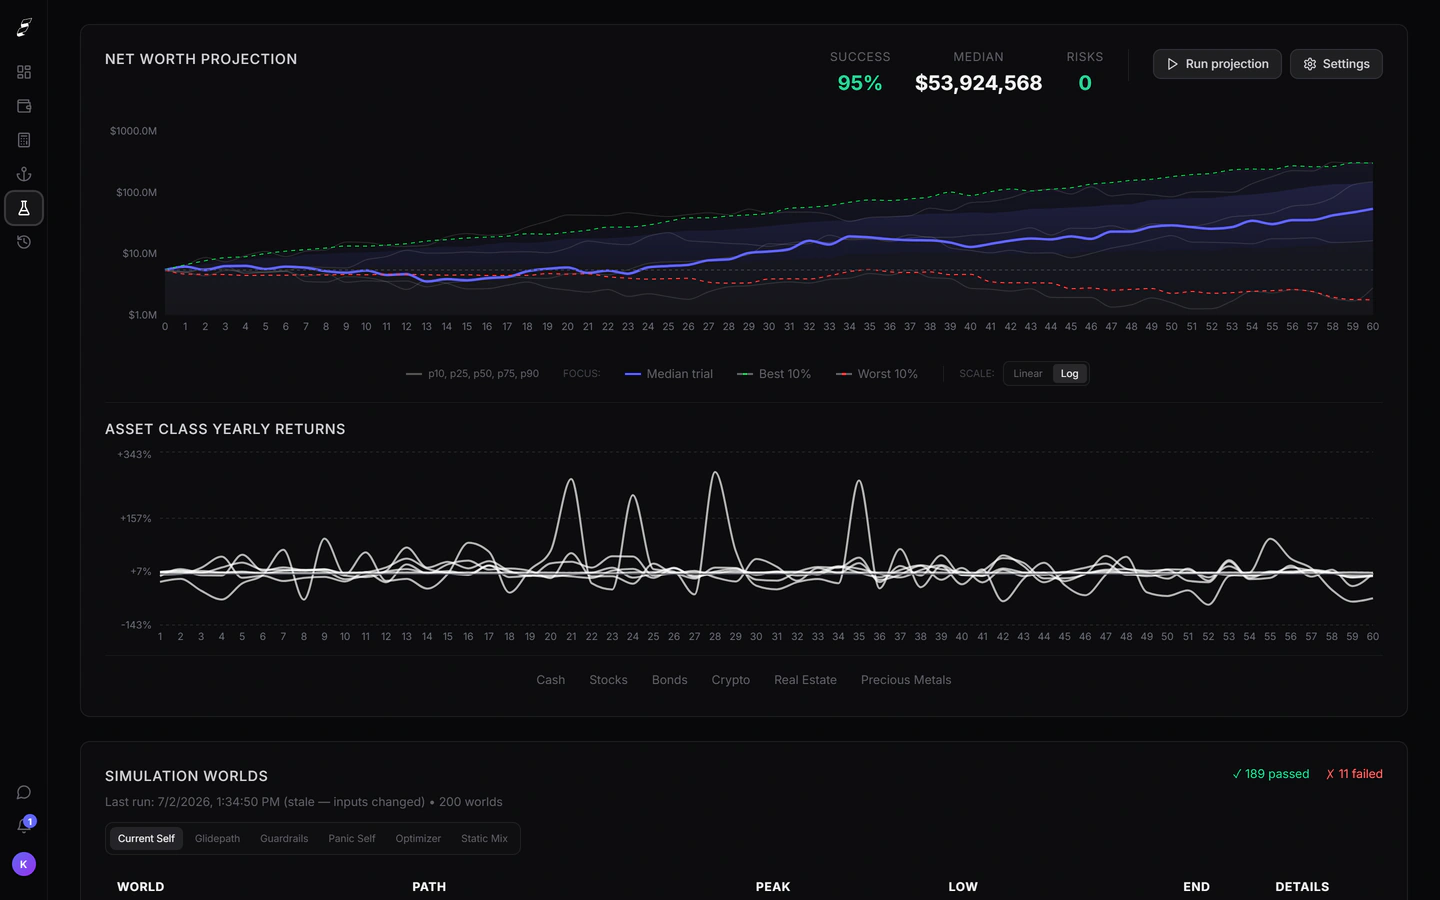
Virtual Scenarios runs your plan through a 1,000-path Monte Carlo simulation and shows the odds, not a single number. Test a market crash, a career change, or a different withdrawal rate, and watch a point estimate become a probability of success you can actually plan against.

  • 1,000-path Monte Carlo projection
  • What-if scenarios, compared side by side
  • A probability of success, not a point estimate
Why a projection isn’t a plan
Killion Virtual Scenarios screen showing a 1,000-path Monte Carlo projection with a probability of success.
05Stress-test on history

Would your plan have survived the real past?

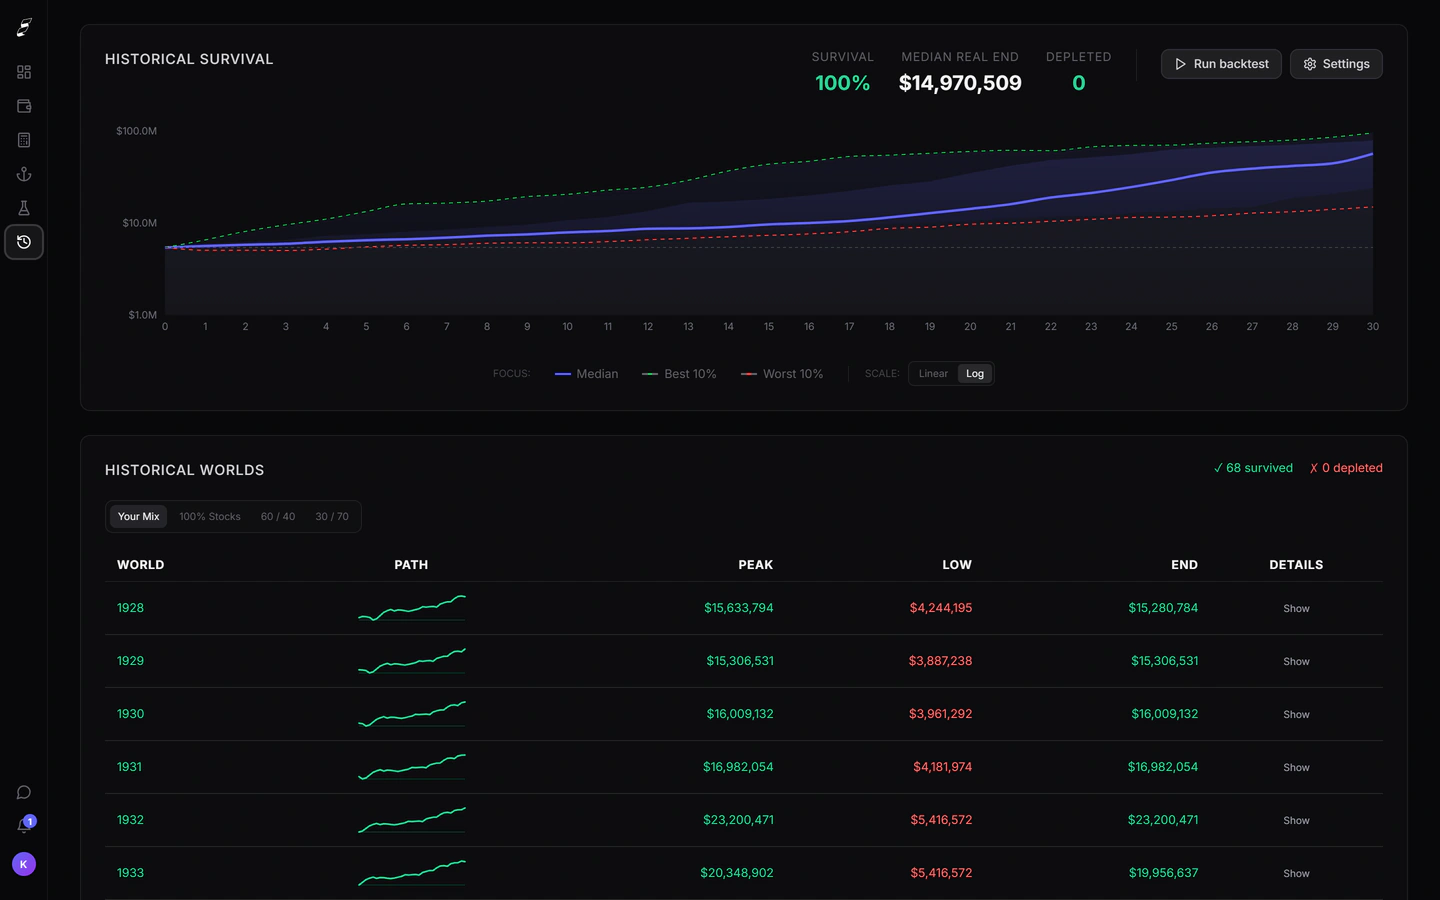
Backtesting replays your allocation through every real market start year since 1928 — actual history, not simulated returns — and reports how often a plan like yours would have lasted a full retirement. Compare your mix against 100% stocks, 60/40, and a conservative 30/70 on identical years, then open any single start year to see its full path and deepest drawdowns.

  • Every market start year since 1928
  • Survival rate vs 100/0, 60/40, and 30/70
  • Drill into any single year’s path
We benchmarked six strategies on the same markets
Killion Backtesting screen replaying an allocation through historical market start years with survival rates.

What Killion does not do

Worth stating plainly. Killion does not model taxes, so there is no Roth conversion or IRMAA planning. It has no shared household access. Automatic bank linking is paused while we move to a new provider, so cash balances are entered manually. And Killion is software: it is not a registered investment adviser and gives no advice.

If tax sequencing is your live question, Boldin is the better tool and we say so on the comparison page.