
Ask the internet for the best way to invest and you’ll get a dozen confident, contradictory answers. Buy and hold and never look. No, rebalance religiously. No, glide to safety as you age. No, keep dry powder and flex your spending. Each one arrives with a backtest that proves it, and that is exactly the problem. Every backtest runs on a different stretch of history, a different starting point, a different set of assumptions. You aren’t comparing strategies. You’re comparing lucky decades.
So we did the thing the arguments never do. We took six strategies and ran every one of them through the same 5,000 simulated lifetimes. Identical markets, identical household, identical everything. We changed only the rule for managing the money. Then we asked the obvious question: which one actually won? The honest answer turned out to be far more useful than a single winner.
How the race was run
One household, lived 5,000 times. A 40-year-old with $250,000 invested, saving steadily through their working years, retiring at 65, then drawing on the portfolio to age 90. That is fifty years of market weather in every run, and the weather is not a tidy bell curve. Killion’s engine moves through clustering market regimes (expansions, recessions, stagflation, crises, recoveries), so downturns persist, crashes drag correlated assets down together, and risk arrives in streaks rather than politely on schedule.
Here is the trick that makes this a fair fight, and not just another backtest. In any given world, all six strategies face the exact same sequence of returns and the same life. Same crash in year 19. Same boom in year 31. So when two strategies finish in different places, the gap is the strategy itself, never luck. That is the entire reason to simulate instead of cherry-pick: it holds the markets still so the decisions can move. The six contenders:
- Buy & hold: set an allocation once and never touch it; let the winners run.
- Rebalance: hold a fixed 80/15/5 mix and trim back to it every year.
- Glide path: start aggressive and automatically shift toward safety with age.
- Guardrails: hold the mix but flex spending, cutting back after bad years and spending a little more after good ones.
- Optimizer: tilt toward the mix with the best risk-adjusted trade-off.
- Panic seller: the involuntary one. After a 20% drop, sell to cash and wait six months before easing back in. Nobody picks this on a calm afternoon; markets pick it for you at 2 a.m.
It’s worth being clear about what 5,000 worlds buys you that a single backtest can’t. The same long-run average return, dealt in a different order, produces wildly different retirements. A great decade followed by a crash is a very different life from the crash coming first. By replaying every strategy across thousands of orderings, the benchmark stops rewarding the one lucky sequence that happened to flatter a favorite approach and starts measuring how each strategy holds up across all the orderings that didn’t go its way. That is the difference between “this worked once” and “this tends to work.”
The leaderboard
Score all six on what a retirement actually cares about. Did the money last, how much was left at the end, how rough was the ride, and how much did you get to spend? Here is the result:
| Strategy | Money lasts | Median at 90 | Worst 5% | Max drop | Safe spend |
|---|---|---|---|---|---|
| Rebalance | 85.5% | $2.32M | $0* | 51% | $8,892/mo |
| Optimizer | 86.4% | $2.19M | $0* | 48% | $8,652/mo |
| Buy & hold | 83.5% | $2.08M | $0* | 57% | $8,084/mo |
| Guardrails | 100% | $1.66M | $379K | 54% | $6,174/mo |
| Glide path | 89.5% | $1.55M | $0* | 33% | $7,057/mo |
| Panic seller | 96.5% | $0.39M | $33K | 43% | $2,014/mo |
*$0 = the bottom 5% of those worlds ran out of money before age 90.
Read down any single column and you can crown a winner. Read across, and the winner keeps changing. No strategy tops every column. Not one. That isn’t a gap in the data; it’s the whole answer, and the rest of this piece just walks through what each column is trying to tell you.
If you never want to run out → Guardrails
Start with the fear that drives most retirement planning: outliving your money. On that axis there is a clear champion. Guardrails is the only strategy that lasted in 100% of the 5,000 worlds, and the only one with a real floor beneath it. In the worst 5% of outcomes it still left $379,000; every pure-growth strategy, in those same brutal worlds, left nothing at all.
The reason is almost boring: when markets fall, guardrails simply spends less, so it never has to sell deep into a crash and never draws the account down to zero. It’s flexibility, not forecasting, that buys the safety. And it isn’t free. Guardrails ends with a smaller median balance ($1.66M) than the growth strategies, and by design it asks you to tighten your belt in exactly the years a downturn already feels frightening. But if your one non-negotiable rule is “do not run out,” nothing else in the field comes close.
If you want to end with the most → Rebalance, Optimizer, Buy & hold
Flip the question to “which leaves me richest” and an entirely different group takes the podium. Rebalance finishes with the highest median wealth at 90, $2.32M, with the optimizer ($2.19M) and plain buy-and-hold ($2.08M) close behind. Buy-and-hold owns the single highest ceiling of all: in the luckiest tenth of worlds it ends north of $16M, because it never once trims a winner.
But look at what those big medians are sitting on top of. These same three strategies are the ones that ran out of money in roughly one of every six or seven lifetimes, and when they fail, they don’t fail by a little. They fail to zero. The wealth and the ruin grow from the same root: they stay fully exposed, so the good worlds compound enormously and the bad ones drain all the way down, especially when a crash hits early in retirement and withdrawals are eating into a shrunken balance.
Buy-and-hold pays an extra, quieter tax for doing nothing at all. It has both the worst odds of lasting (83.5%) and the deepest typical drawdown of any strategy here, because letting winners run also means letting risk pile up unchecked. Your “80/15/5” quietly becomes “95/4/1” after a long bull market, right before the market reminds you why you diversified. Doing nothing is a decision, and it has a cost.
It’s also worth seeing why rebalancing edged plain buy-and-hold even though they land in nearly the same place on wealth. Rebalancing isn’t really a return booster; it’s a risk discipline. By trimming whatever has run up and topping up whatever has lagged, it keeps the portfolio from quietly drifting into a far riskier mix than you ever chose. That is why it lasted a little more often (85.5% versus 83.5%) and rode out shallower drops. Buy-and-hold’s extra upside and its extra fragility are the same coin: because it never sells a winner, it’s always carrying the most risk at exactly the moment a downturn would hurt the most.
If you want a smooth ride → Glide path
There’s a third way to win, and it’s the one your stomach votes for. The glide path, aggressive when you’re young and steadily more conservative as retirement nears, delivered the smoothest ride in the field by a wide margin.
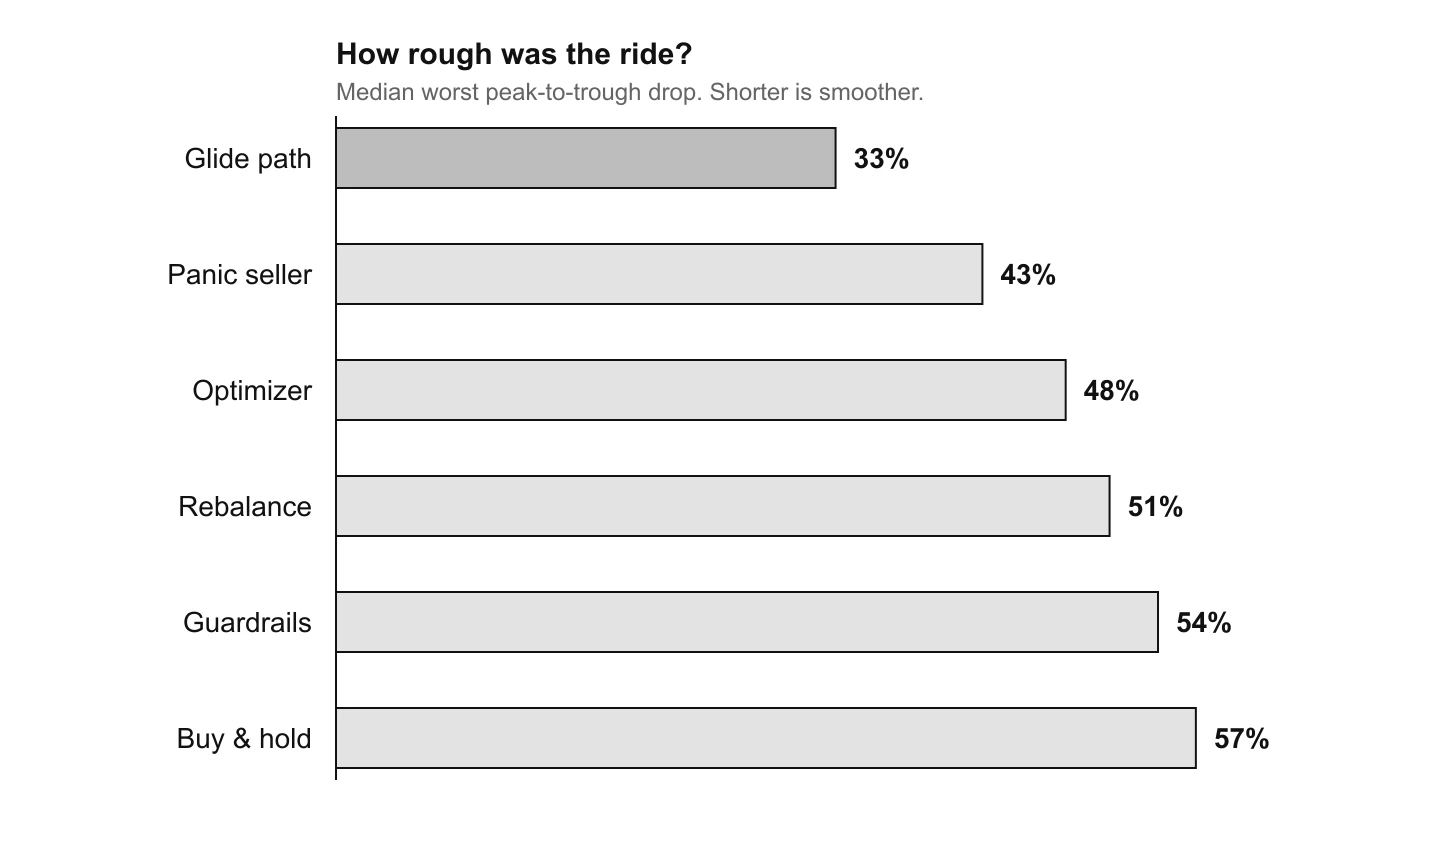
A median worst drop of 33%, against 57% for buy-and-hold, is nearly half the gut-punch. It gives up some upside for that calm (median $1.55M), and it still lasts more often than any of the pure-growth strategies (89.5%). That trade matters more than the raw numbers suggest, for one human reason: the thing most likely to wreck a good plan is the person running it. A strategy that makes the ride less terrifying is a strategy you’re more likely to actually stick with when it counts. That brings us to the contender that proves the point.
The one that loses everywhere → Panic selling
Here is the strategy nobody chooses and most people end up running anyway. Panic selling does one thing genuinely well: it survives. By bailing to cash after every serious drop, it dodges the deepest crashes and lasts in 96.5% of worlds, second only to guardrails. And then it spends the next thirty years paying for that survival.
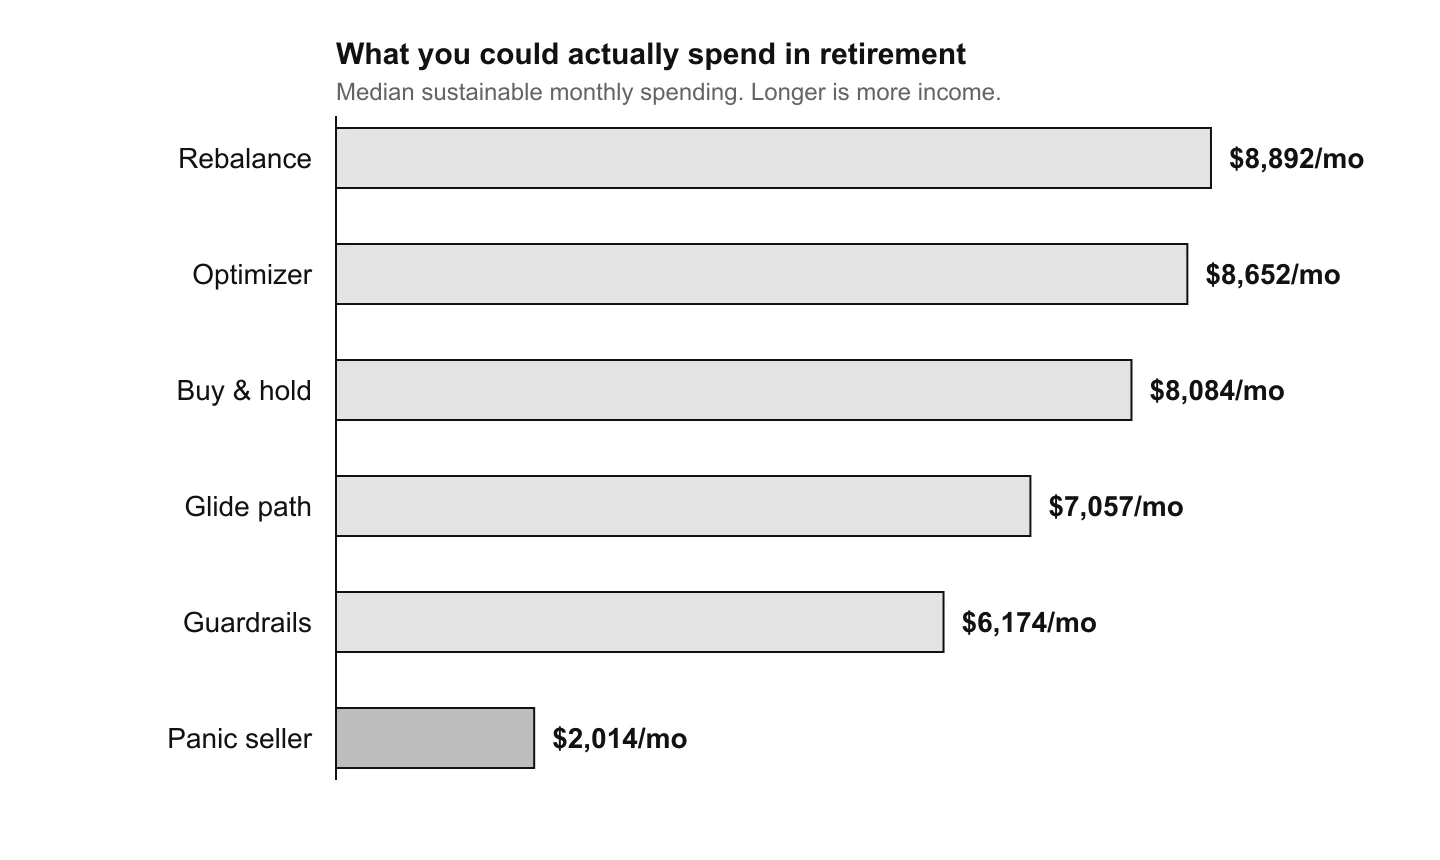
The panic seller ends with a median of $390,000, less than a fifth of what the disciplined strategies leave, and can sustainably spend just $2,014 a month, against $6,000 to $8,900 for everyone else. It’s the only strategy in the field beaten by all five others on the things you’d actually feel. And notice the lesson is not “panic is risky.” Panic is, narrowly, safe. It almost never goes broke. The trouble is that panic is the most expensive kind of safe there is: you don’t go broke, you just stay poor. Selling after the fall locks in the loss and guarantees you miss the recovery, which was the entire reason to own stocks in the first place.
There’s no winner, only a frontier
Put every strategy on a single chart, plotting how often the money lasts against how much it leaves behind, and the real shape of the answer finally appears.
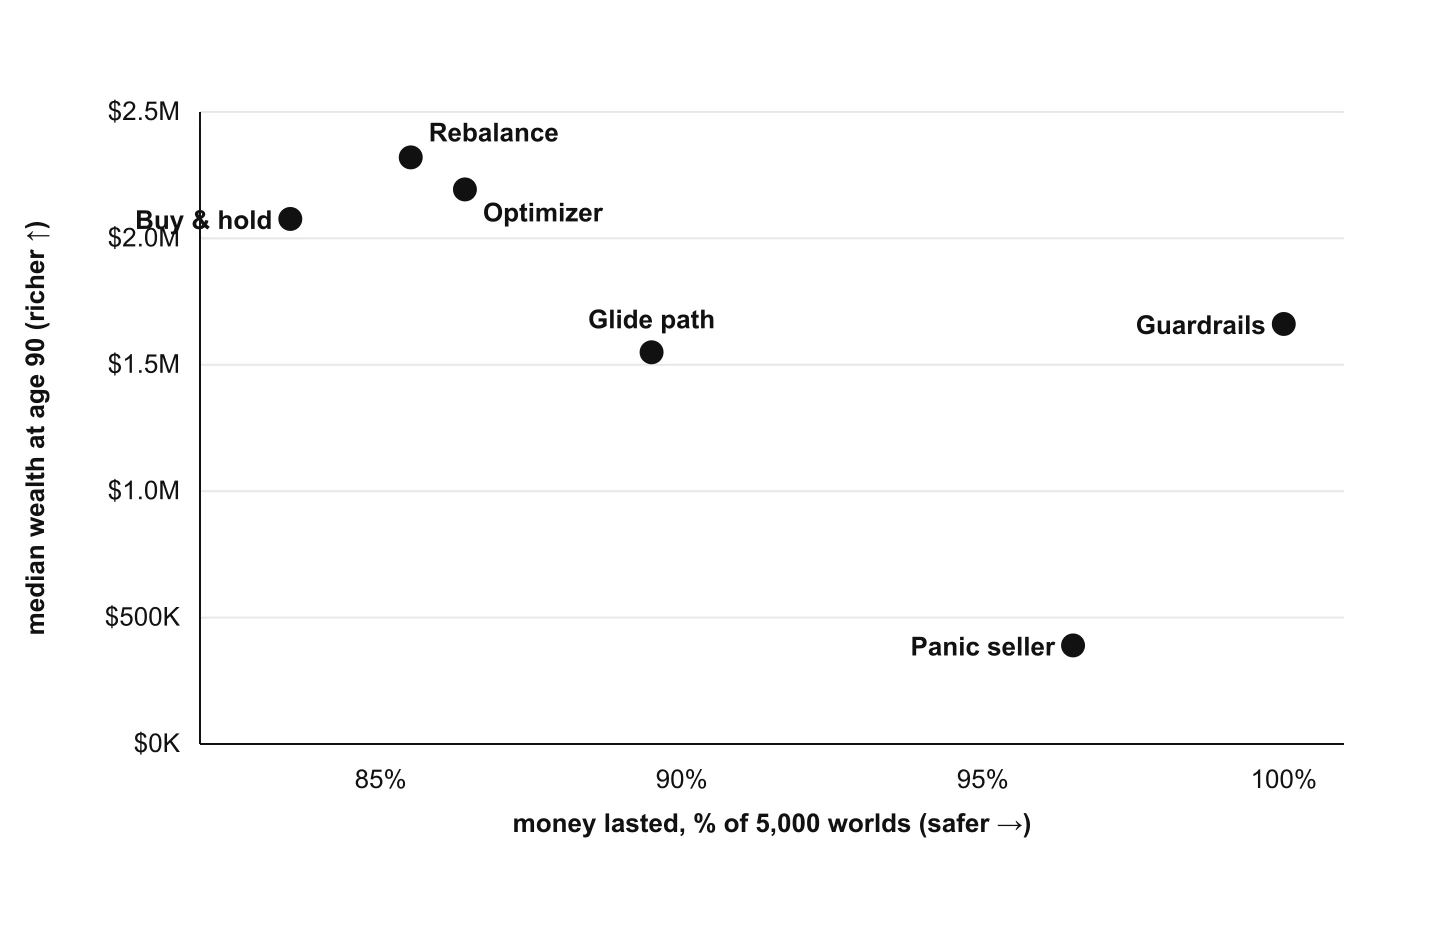
It isn’t a ranking. It’s a frontier. Safety and wealth pull against each other, and each strategy is just a different bet on that trade-off. Guardrails buys near-perfect survival by surrendering upside and asking your lifestyle to bend. The growth strategies buy the biggest balances by accepting a real chance of ruin. The glide path buys a calmer ride. And panic sits below the frontier entirely, the one bet available to you that gives something up on every axis at once.
Which is why “which strategy wins?” is the wrong question. It hides the only one that matters: which failure can you least afford? If running out would be catastrophic, with no other income and no room to cut, the math leans hard toward survival and flexibility. If leaving money on the table is the regret you’d feel most, and you have both the flexibility and the nerve to ride the drops, it leans the other way. There is no universally right answer because these aren’t better and worse versions of one thing. They’re answers to different questions. The only result that held across the entire experiment is the one nobody chooses on purpose: letting fear trade for you loses on every axis at once.
A practical way to find your own spot on that frontier: ask what you would actually do in the worst tenth of these worlds. If you could comfortably trim your spending to ride them out, then the growth strategies’ ruin risk is largely theoretical for you, and their bigger balances are real money. If you couldn’t, if most of your spending is fixed and a bad decade would force your hand, then the strategies that flex or de-risk aren’t the timid choice. They’re the correct one. Same chart, opposite answer, and the only thing that changed is you.
The version that’s actually about you
Every number here came from one stand-in household. Yours is different in the ways that decide everything: your savings rate, your retirement date, how much of your spending could flex if it had to, and how big a drop you can actually sleep through. Those inputs are exactly what move your point along the frontier, and they’re the difference between a chart that’s interesting and one that’s about your life.
Notes on the figures. Every number was computed from a live run of Killion’s own simulation engine on one hypothetical household: age 40, $250,000 invested, an 80% stocks / 15% bonds / 5% cash allocation, saving while working and retiring at 65, then drawing the portfolio down to age 90, across 5,000 simulations on the engine’s regime-switching environment (seed fixed for reproducibility). All six strategies face identical market and life paths in each world, so differences reflect the strategy alone. “Money lasts” is the share of worlds that never hit zero; “median at 90” and “worst 5%” are ending balances; “max drop” is the median worst peak-to-trough decline; “safe spend” is the median sustainable monthly withdrawal. The panic seller sells fully to cash for six months after any 20% drawdown. All dollar figures are nominal. This article is educational analysis, not investment advice, and does not recommend any security or strategy.
References
- On de-risking with age (“glide paths”), the foundational argument is in the target-date/lifecycle literature; for a critical view see Robert C. Merton’s work on lifecycle investing and retirement income.
- Flexible-withdrawal “guardrails” trace to Jonathan Guyton and William Klinger, “Decision Rules and Maximum Initial Withdrawal Rates,” Journal of Financial Planning (2006); the classic fixed-rate benchmark is William Bengen’s 4% rule (1994).
- “Sequence-of-returns risk,” the danger that the same average return produces very different outcomes depending on when the bad years fall, is most acute in the first years of retirement, which is why early crashes do outsized damage above.
- On panic selling and the gap between investor returns and investment returns, see DALBAR’s annual Quantitative Analysis of Investor Behavior; the broader case for staying invested is in our own analysis of timing the market.