
One percent does not sound like a lot. It is one penny on the dollar, every year, quietly deducted from the balance you never quite see. Fund prospectuses bury it in the expense ratio. Advisors describe it as “a reasonable fee for professional management.” And because it is expressed as an annual percentage rather than a dollar figure, most investors never convert it into the only unit that matters: how much less money you have at the end.
You should convert it. A 1% annual fee does not remove 1% of your wealth over a lifetime. It removes a compounding slice from a compounding balance, and the slice grows as the balance grows. Over forty years of steady saving, the gap is not a rounding error. It is a second house. Or an extra decade of retirement spending. Or the difference between a plan that clears your goals in most worlds and one that misses in the bad ones.
We ran the arithmetic through Killion's regime-switching simulation engine, the same one behind our Monte Carlo analysis and our strategy benchmark, on a forty-year accumulator household across 5,000 market lifetimes. The fee was modeled as a direct reduction in expected asset-class returns, holding volatility and correlations fixed. The result is a clean, apples-to-apples drag estimate, and it is larger than the fee sounds.
The household
The exercise is deliberately narrow: no advisor alpha, no tax-loss harvesting, no factor tilts. Just contributions, market weather, and a fee shaved off expected returns. That narrowness is a feature. It isolates the cost of the fee so you can decide what would have to be true about advice, coaching, or outperformance for the price to make sense.
Start with $250,000 invested at age 40. Save $2,000 per month for forty years, the same savings cadence as our other simulation articles. Hold an 80% stocks / 15% bonds / 5% cash allocation and let the portfolio compound through five clustering market regimes: expansions, recessions, stagflation, crises, recoveries. No withdrawals, no glide path, no rebalancing tricks. Just contribution, return, and time.
We ran three versions of this life, identical except for a bundled expense ratio applied uniformly across asset classes:
- 0% fee: the frictionless baseline.
- 0.5% fee: a competitive index-fund or robo-advisor all-in cost.
- 1.0% fee: a typical actively managed fund or advisor wrap fee.
Same seed. Same 5,000 worlds. Same sequence of bull markets and crashes. Only the net return layer changed.
What forty years cost
Convert the fee to dollars once and you stop negotiating with yourself. At a $1 million balance, a plausible midpoint long before the simulation ends, a 1% expense ratio is $10,000 every year whether the portfolio rose or fell. Over forty years that steady drip becomes the six-figure median gap in the table below. The percentage stayed constant. The damage did not.
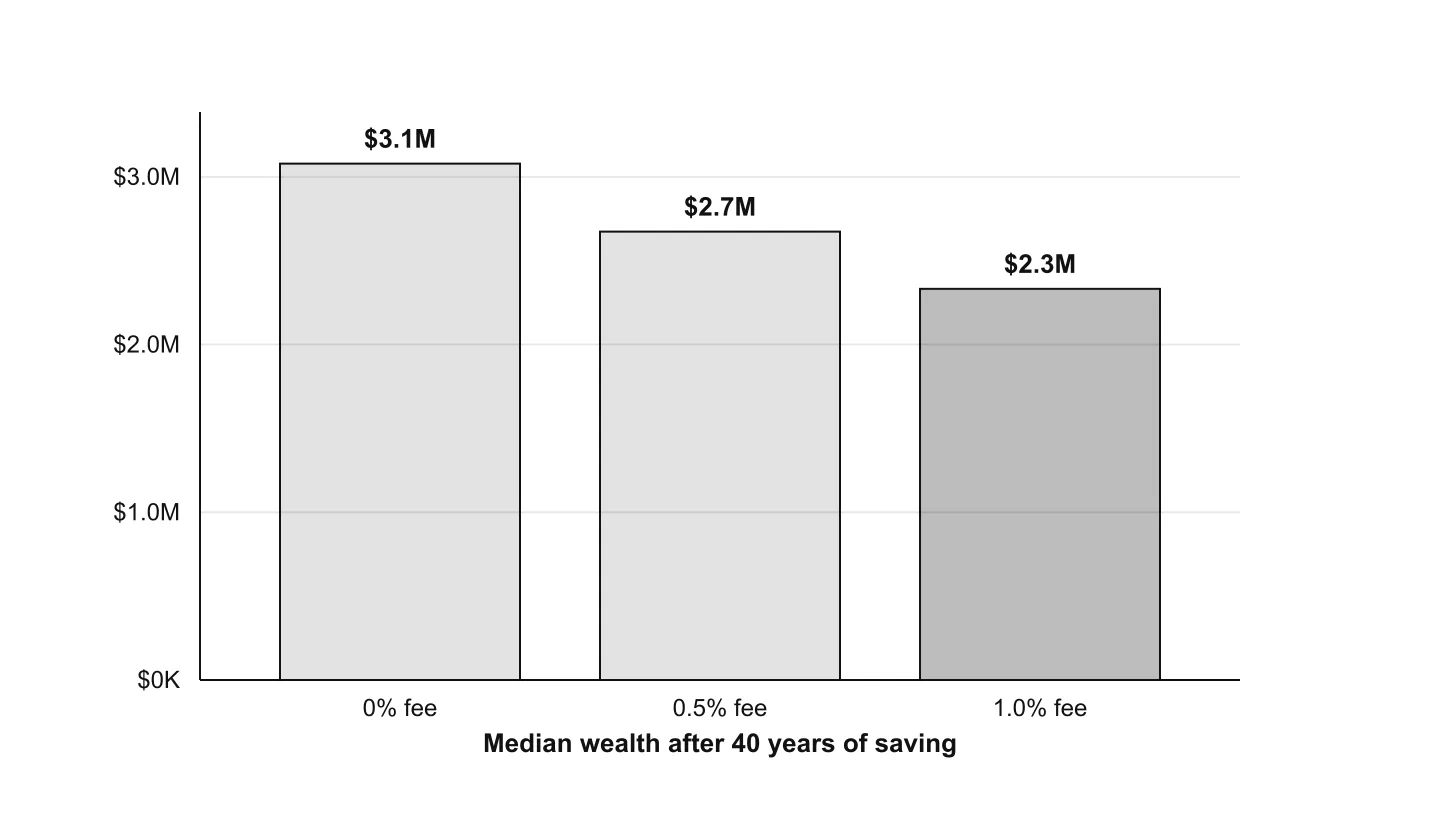
At the median outcome, the world where you finish in the middle of the distribution, the ending balances after forty years were:
| Expense ratio | Median at year 40 | 5th percentile | 95th percentile | Gap vs. 0% |
|---|---|---|---|---|
| 0% fee | $3.08M | $987K | $15.75M | $0 |
| 0.5% fee | $2.67M | $898K | $13.40M | −$405K |
| 1.0% fee | $2.33M | $816K | $11.33M | −$746K |
The 1% fee cost $746K at the median, 24.2% of the no-fee ending balance. You contributed roughly $960K over forty years ($250K starting plus $2,000/month). The fee did not take 1% of that. It took nearly a quarter of what your contributions and starting balance produced together.
Even the 0.5% fee, the one that sounds “low,” cost $405K at the median. That is not a rounding error on a spreadsheet. That is a year or two of retirement spending, gone, for the privilege of a slightly smaller number on your statement every month.
How the gap opens
The damage is not linear. It accelerates. In the early years, when the balance is small, 1% of not much is not much. The lines in the chart below track the median wealth path, the center of the 5,000-world cone, at each fee level. They start together at $250,000. They do not stay together.
By year 20, the 1% path is already six figures behind. By year 40, the gap is $746K. The fee did not just reduce each year's return by one point. It reduced the base that every future return compounded on. That is volatility drag's quieter cousin: a fixed annual subtraction has an outsized effect on geometric growth, the same reason arithmetic average returns overstate what compounding actually delivers, a point we developed in our Monte Carlo article.
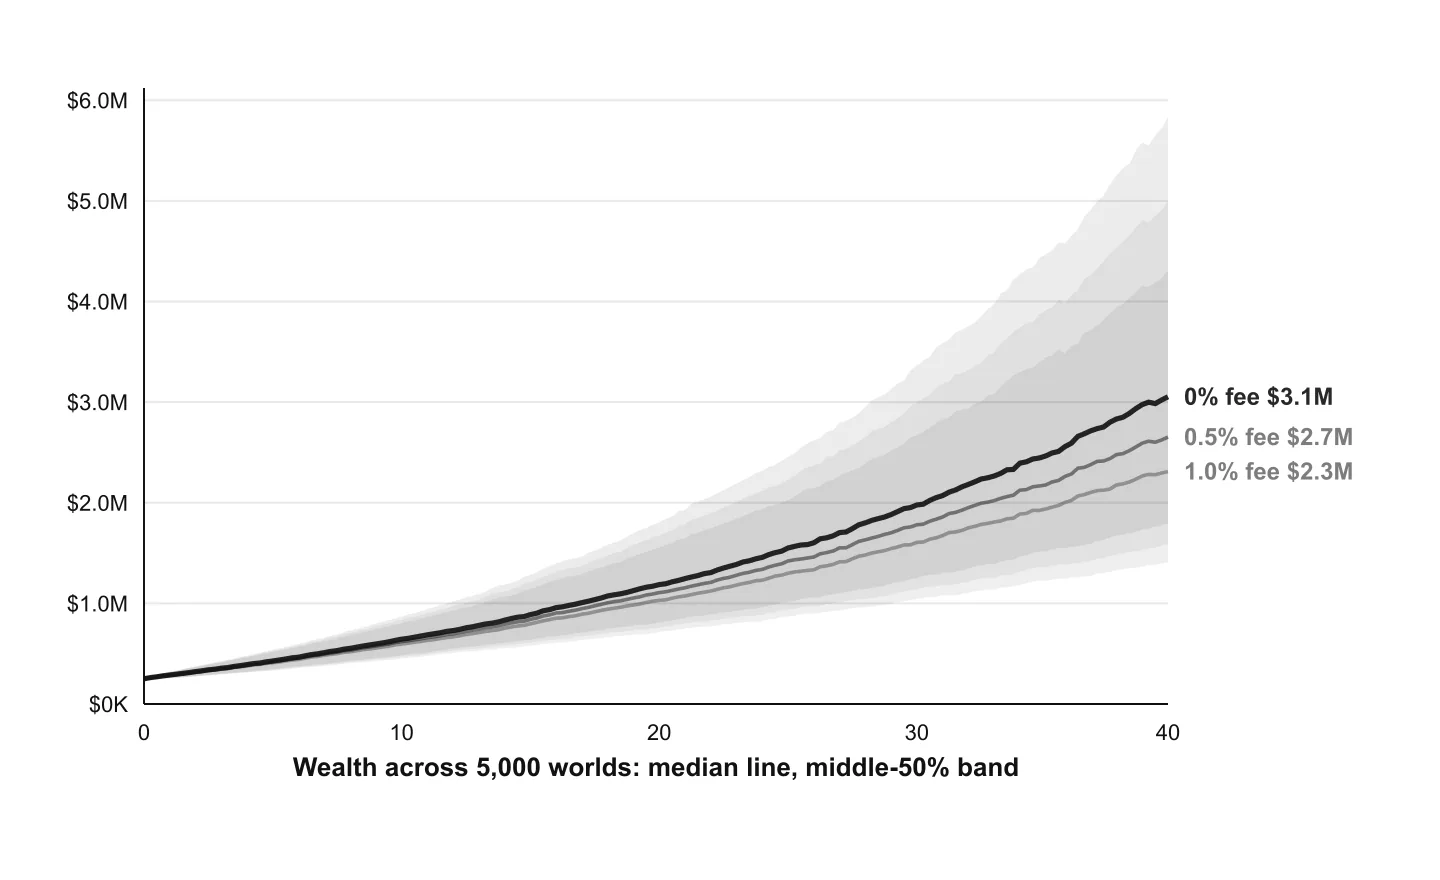
Look at the tails, not just the median. At the 5th percentile, the bad worlds, the no-fee household still finished with $987K. The 1% fee household finished with $816K. Fees do not just shrink the upside. They shrink the cushion you have when the downside arrives. In retirement planning, the cushion is the whole game.
The contribution you never made
Another way to see the $746K median gap: by year six the no-fee median path had already reached $466K while you were still depositing $2,000 a month into a balance that had not yet compounded into seriousness. The fee did not just tax the finish line. It taxed the ramp. Every dollar not compounding in year three is a dollar that never gets a thirty-year run.
At year 20, the median no-fee balance had reached $1.19M. The 1% fee path was still near $1.03M. That is roughly $156K missing before the final decade, the decade when the largest absolute gains usually arrive. Opponents of fee scrutiny say “focus on what you can control.” The expense ratio is one of the few drags you can control with a form signature, and it never takes a year off.
Why the math fools people
Three intuitions misfire.
“It is only 1%.” One percent is the annual charge. The lifetime charge is the accumulated difference in compounded balances. On $3.08M, 1% is $31K, per year, forever, on a balance that only grows. Over forty years the median cumulative drag is $746K. The percentage sounds small because it is expressed in the wrong unit.
“Active management earns it back.” Maybe, in some years, for some managers. But the fee is charged in all years: up markets, down markets, flat markets. To break even on a 1% fee, the manager must outperform by more than 1% after the fee, consistently, over decades. The SPIVA scorecards show how rare that is. Our simulation does not even model alpha; it holds returns constant and subtracts the fee. The $746K gap is the pure cost of the fee, with no offsetting skill assumed.
“I will switch to cheaper funds later.” The paths chart shows why that is costly. The early years, when the balance is smallest, feel like the fee does not matter. But the dollars you lose early are the dollars that would have compounded the longest. A fee paid at 40 costs more than the same fee paid at 60, because it amputates more years of growth. Waiting to optimize is itself expensive.
When the comparison is unfair, and when it is not
A fair comparison assumes you get nothing for the fee. Real life is messier. A good advisor who keeps you invested through a crash (the behavior gap we measured in our market-timing analysis) may be worth more than 1% in the worlds where panic would have pushed you to cash. Tax planning, account location, and withdrawal sequencing can add value the simulation does not capture.
But the burden of proof is on the fee, not the investor. “This might be worth it” is not the same as “this paid for itself in every world.” Our numbers are the floor: if the service does not deliver at least $746K of value over forty years, you would have been better off in the index fund.
The comparison is also unfair in the other direction if you ignore taxes, trading costs, and turnover inside active funds. The 1% expense ratio is not the only drag. It is just the visible one. All-in costs on some products run higher. The simulation uses a single bundled figure precisely so the argument stays honest and traceable.
What actually moves the needle
Fees are one lever. They are rarely the biggest one. On the same household, changing the savings rate or working two more years often swings the outcome more than switching from 1% to 0.1%. But fees are the lever you can pull today, without earning more or retiring later, and they never revert. A raise can disappear. A lower expense ratio compounds forever.
The practical hierarchy looks like this:
- Savings rate and time in market: the primary drivers of terminal wealth. See our staying-invested analysis for why missing the best months costs more than most fees ever will.
- Asset allocation and withdrawal policy: the primary drivers of retirement safety. See our strategy benchmark and our 4% rule analysis.
- Fees: a guaranteed subtraction from whatever the first two levers produce. Small in any given year. Enormous in the sum.
The $746K median gap in this simulation is what lever three costs in isolation. It is not a reason to obsess over basis points at the expense of saving more. It is a reason to stop treating a 1% fee as negligible once the balance crosses six figures.
Half a percent is not half the problem
Intuition says a 0.5% fee should cost half of what a 1% fee costs. Compounding disagrees. At the median, the 0.5% fee cost $405K, about 54% of the full 1% drag, not 50%. The first half-point bites on a smaller base; the second half-point bites on a larger one. Fee arithmetic is convex: each additional basis point removes more dollars than the one before it, because the balance it taxes is bigger.
At the 5th percentile, the gap between 0% and 0.5% was $89K; between 0.5% and 1% it was another $82K. Downside protection erodes the same way upside does. A household that thinks it has “only” moved from 1% to 0.5% has recovered less than half the lost cushion, and the remaining gap is still measured in hundreds of thousands of dollars at the median.
What the gap buys in retirement
Accumulation numbers are abstract until you translate them into spending. Take the median $746K fee gap and spread it over a twenty-five-year retirement. That is roughly $2,488/month of portfolio capacity you never had, before adjusting for inflation, before the next bear market, and without touching Social Security or other income. It is the difference between a withdrawal policy that clears the left tail and one that scrapes against it.
Connect the fee article to the decumulation question and the picture sharpens. In our 4% rule analysis, flexible guardrails at 4% produced a median sustainable spend of about $7,500/month on the same household profile. Shave $746K off the portfolio before retirement and you are not shaving a line item on a statement. You are shaving the base that every future withdrawal percentage compounds against, the same mechanism that made rigid 4% fail in 1.1% of worlds while flexible 4% survived all 5,000.
Fees are an accumulation story that only becomes visible at the finish line. Withdrawal policy is a decumulation story that only becomes visible when the finish line is not high enough. Paying 1% for forty years and then rigidly withdrawing 4% is two quiet risks stacked: less money arriving at 65, and less flexibility once it does.
See it on your numbers
The gap scales with your balance and your timeline. A 30-year-old with $50,000 faces a smaller absolute drag but loses a larger share of the growth runway. A 55-year-old with $1.5 million faces a fee bill measured in tens of thousands per year, before the next crash, before the next recovery, regardless of either.
Plug your own accounts into the same simulation and the abstract percentage becomes a dollar figure you can weigh against everything else in the plan. That is the whole point of running 5,000 worlds instead of one projection: the fee's cost is not a single number. It is a distribution, and the left tail is where planning mistakes hurt.
How does 1% compare to other quiet wealth leaks? In our timing study, missing just the ten best S&P 500 months in forty years cut ending wealth by roughly two-thirds. Behavior can dwarf fees when behavior breaks. But behavior is intermittent; the fee is annual and automatic. You do not have to miss a bull market to pay it. You only have to own the fund.
At the 95th percentile, the great outcomes, the no-fee household finished with $15.75M and the 1% fee household with $11.33M. Even when markets are generous, the fee slices $4.43M off the top. You pay on upside you barely notice and on downside you absolutely do. The fee is the one line item that never sends you a receipt for the compounding it stole.
Notes on the figures. Every number was computed from a live run of Killion's own simulation engine on one hypothetical forty-year accumulator: $250,000 starting balance, $2,000/month net savings, 80% stocks / 15% bonds / 5% cash allocation, no withdrawals, across 5,000 simulations on the engine's regime-switching environment (seed 20260622). Fees were modeled as a uniform reduction in each asset class's annualized expected return (μ) within every regime, holding volatilities and correlations fixed: a bundled expense-ratio approximation, not a separate trading-cost model. Median paths plot the p50 cone center at quarterly intervals, deflated to today's dollars. All dollar figures are real, inflation-adjusted to the present. This article is educational analysis, not investment advice, and does not recommend any specific fund or advisor.
References
- On volatility drag and the gap between arithmetic and geometric returns, see our Monte Carlo simulation article and standard treatments of compound growth.
- SPIVA U.S. Scorecard (S&P Dow Jones Indices): periodic report on active fund underperformance vs. benchmarks after fees.
- On the behavior gap between investor returns and investment returns, see DALBAR's Quantitative Analysis of Investor Behavior and our staying-invested analysis.
- James D. Hamilton, regime-switching models of economic time series (Econometrica, 1989): foundation for Killion's five-regime environment.