
The 4% rule is one of the most quoted sentences in retirement planning: withdraw 4% of your portfolio in year one, adjust for inflation, and you are overwhelmingly likely to make it thirty years. It has survived two bear markets, countless blog posts, and a decade of low interest rates. It feels like settled science.
It is also answering a different question than the one you are actually living. The rule was built on historical U.S. stock-and-bond returns, a fixed thirty-year horizon, and a withdrawal policy that does not flinch when the portfolio shrinks. Your retirement is not thirty years of average weather. It is one specific sequence of expansions, crashes, inflations, and recoveries, and whether you can flex when that sequence turns hostile matters as much as the starting percentage.
So we ran the question through Killion's engine the way we run every hard planning argument: one stand-in household, 5,000 regime-switching market lifetimes, identical weather in every world, and only the withdrawal rule changed. The answer is not a simple yes or no. It is a trade-off table, and the column most people skip is the one that decides whether the money actually lasts.
What we tested
Before the numbers: this is not a pitch for any withdrawal rate. It is a stress test of the claim that 4% is “still safe” in a world of clustered crashes and decade-long recoveries, the world our Monte Carlo article argues you should plan in, not the smooth-average world most calculators still use.
The household is the same one behind our other simulation articles: a 40-year-old with $250,000 invested in an 80% stocks / 15% bonds / 5% cash mix, saving $2,000 per month while working, retiring at 65, and living to 90. That is fifty years of compounded uncertainty: accumulation first, then three decades of drawing the portfolio down while $2,000 per month of Social Security offsets part of the spending need.
We compared seven withdrawal policies across the same 5,000 worlds (seed fixed for reproducibility):
- Flexible guardrails at 3%, 4%, 5%, and 6%: start retirement by withdrawing that percentage of the portfolio, then review annually. If the withdrawal rate drifts more than 20% above the initial target after a bad sequence, cut spending by 10%; if it drifts below, raise it. This is the Guyton-Klinger guardrail logic already in our strategy benchmark.
- Rigid 4% and 5%: same initial percentage, but no cuts or raises, the closest analogue to “set it once and hope.”
- Fixed $5,000 monthly need: the portfolio must fund whatever the lifestyle profile demands, regardless of what the balance just did. This is how many real plans are still written.
Every strategy faced identical crashes, identical booms, identical inflation regimes. When two policies diverge, the gap is the policy, not luck.
The headline numbers
One more piece of context before the table: our guardrails agent initializes retirement withdrawals as a percent of the portfolio at the retirement boundary, then adjusts annually when the realized rate drifts outside a ±20% band around the initial target. That is not identical to Bengen's inflation-stepped dollars, but it is the version of flexible decumulation the engine can enforce consistently across 5,000 worlds, and the version that separates survival from rigidity in the results below.
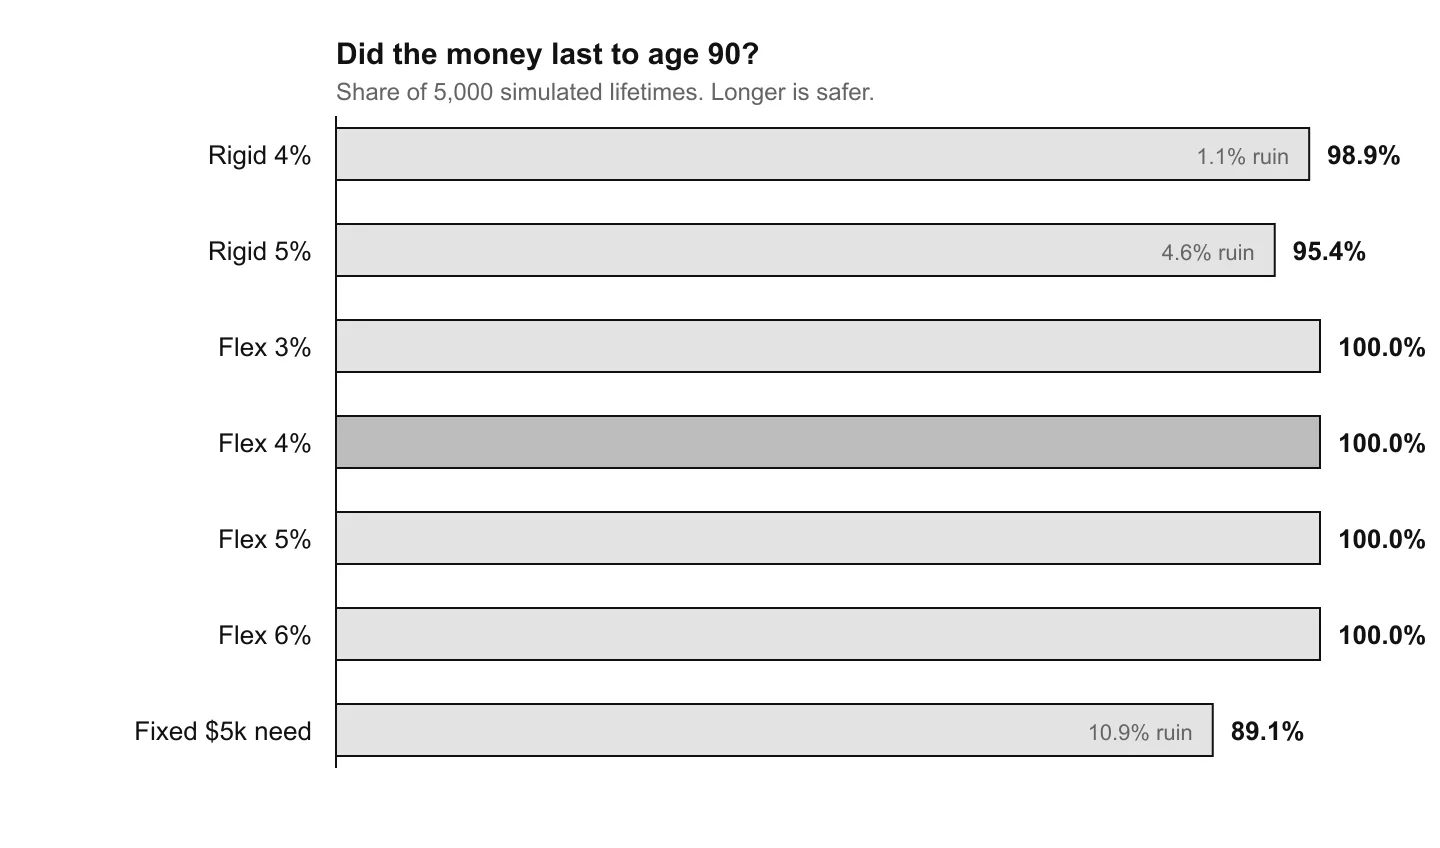
Start with the question people actually mean when they ask if 4% is safe: does the money last? Here is the full table.
| Withdrawal policy | Money lasts | Ruin rate | Median at 90 | Worst 5% | Safe spend |
|---|---|---|---|---|---|
| Flexible 3% | 100% | 0% | $2.54M | $615K | $9,370/mo |
| Flexible 4% | 100% | 0% | $2.03M | $501K | $7,527/mo |
| Flexible 5% | 100% | 0% | $1.61M | $407K | $5,987/mo |
| Flexible 6% | 100% | 0% | $1.26M | $327K | $4,693/mo |
| 4% rigid | 98.9% | 1.1% | $2.36M | $323K | $8,781/mo |
| 5% rigid | 95.4% | 4.6% | $1.82M | $22K | $6,858/mo |
| Fixed $5k need | 89.1% | 10.9% | $2.13M | $0* | $8,193/mo |
*Worst 5% ending balance rounds to zero; the plan hit ruin in those worlds.
Read the table carefully and the popular version of the 4% rule starts to look incomplete. Flexible guardrails at 4% never ran out across all 5,000 lifetimes. So did 3%, 5%, and 6%. But rigid 4% failed in 1.1% of worlds, rigid 5% in 4.6%, and the fixed $5,000 spending profile, the one that does not care what the market just did, failed in 10.9% of them.
That is more than one in ten retirements ending in ruin, on the same markets where a flexible 4% policy survived every single time.
What 4% actually buys you
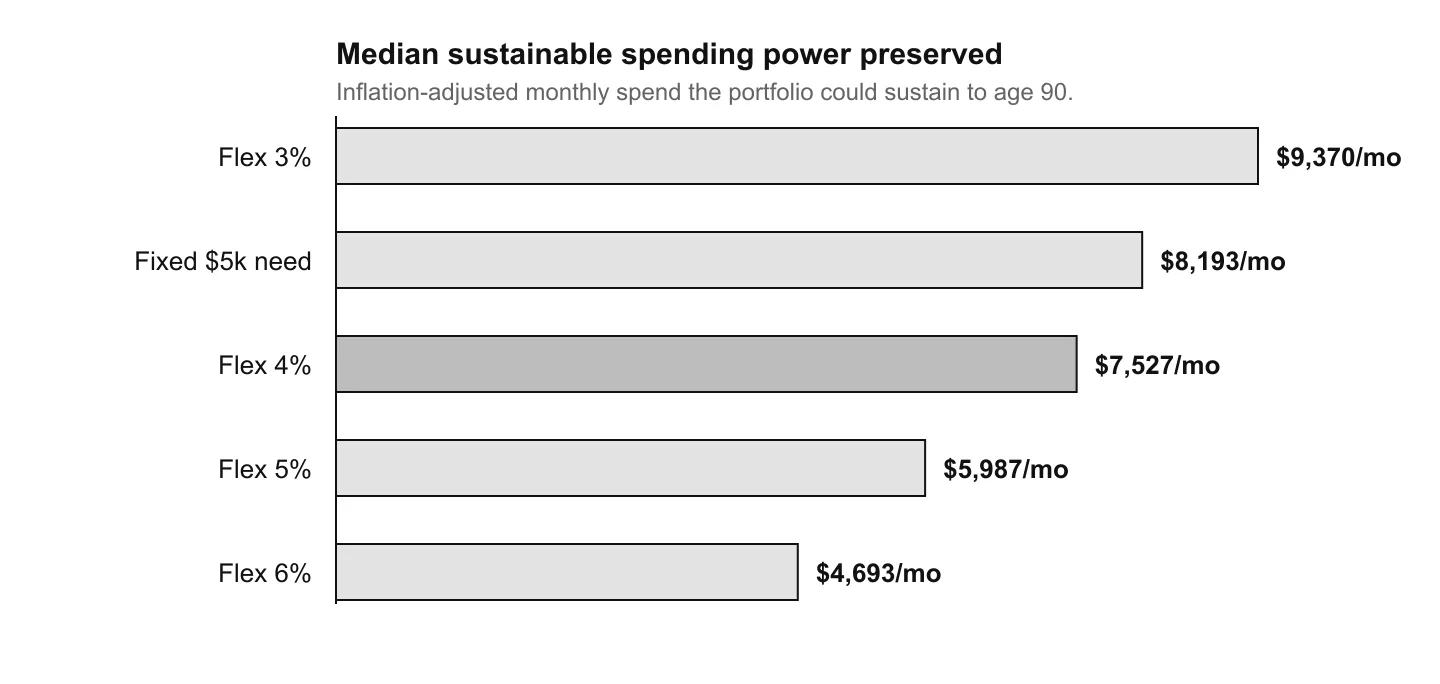
Survival is only half the question. The other half is how much spending power the plan preserves. We measure that with the median sustainable figure: the inflation-adjusted monthly amount the portfolio could still support to age 90 on the median path. At flexible 4% it was $7,527/mo, meaning half of all simulated lifetimes held on to at least that much sustainable monthly capacity without ever hitting zero.
That is not a poverty line, and it is only modestly below the roughly $8,000/mo figure the fixed-spending profile posts, a number the table will show it cannot actually hold in every world. Compare the three policies people most often debate:
- Flexible 4%: $2.03M median ending balance, $7,527/mo sustainable spend, 0% ruin.
- Rigid 4%: $2.36M median ending balance, $8,781/mo sustainable spend, 1.1% ruin.
- Fixed $5k need: $2.13M median ending balance, $8,193/mo sustainable spend, 10.9% ruin.
The fixed profile looks richer on paper, until it does not. In the worst 5% of worlds it leaves nothing. Flexible 4% still had a worst-case ending balance of $501K. That is the entire argument for guardrails in one row: you trade some peak spending for a floor that does not disappear.
Why “still safe” is the wrong framing
Bengen's original 4% rule was a maximum initial withdrawal rate that survived thirty-year windows in U.S. historical data. It was never a guarantee about your specific retirement, and it was never meant to be used without adjustment. The finance industry compressed it into a headline because headlines fit on index cards.
Our simulation makes the compression visible. In a regime-switching environment, where crises cluster, correlations spike, and recoveries take years rather than quarters, the starting percentage matters less than what happens after the first bad year. A flexible 6% policy still lasted in every world we ran, because it cut spending when the portfolio could not support the rate. A rigid 5% policy failed in 4.6% of them, because it kept pulling the same dollars from a shrinking base.
This is the same lesson as our Monte Carlo article, but applied to the decumulation decade: the average outcome is not the binding constraint. The left tail is. A policy that looks generous at the median but fails in one world out of ten is not “safe” in any sense that matters to the person living it.
Sequence-of-returns risk, the subject of our strategy benchmark and the well-known danger that early-retirement crashes do outsized damage, is exactly what guardrails are designed to absorb. The 4% number is a starting point. The guardrails are the actual plan.
The rate ladder: what each point buys
Treat the four flexible policies as a ladder. At 3%, the median legacy at 90 is $2.54M and the median sustainable figure is the highest in the set at $9,370/mo: the lightest draw leaves the most wealth and the most preserved spending power. At 6%, the median legacy drops to $1.26M and the sustainable figure falls to $4,693/mo, because pulling more each year spends the balance down faster. The headline rate is what you take out; the ladder shows what the portfolio keeps.
The 4% rung sits between the extremes: a median ending balance of $2.03M and a median sustainable figure of $7,527/mo. Moving up to 5% gives up about $1,540/mo of preserved capacity and roughly $423K of median legacy, because a heavier draw shrinks the portfolio on both measures. What the higher rate buys back is more cash in hand each year while you are alive. The dominant split in the table, though, is not 4% vs 5%. It is flexible vs rigid vs fixed-need. Whether you want the 4% coordinate specifically is a second-order choice once you have committed to flexing when markets demand it.
Notice that even 6% with guardrails survived every world. The rate is not the failure mode. Rigidity is. Rigid 5% failed more often than rigid 4%, but flexible 5% never failed at all. The flex is doing more work than the percentage.
What the drawdowns feel like from inside the plan
Ruin rates tell you whether the money lasts. They do not tell you what the middle decades feel like. Across the 5,000 worlds, we also tracked the median peak-to-trough portfolio decline during retirement, the drawdown you would have lived through if you landed in the center of the distribution.
Flexible 4% posted a median maximum drawdown of 50.3%. Rigid 4% was similar at 48.8%. The fixed $5,000 profile, which never trimmed spending when the balance fell, posted 54.4%, a deeper hole because the portfolio kept funding the same lifestyle while shrinking. Flexible 6% saw 56.3% median drawdown, the steepest in the flexible set, yet still finished with money in every world because spending stepped down with the balance.
That is the lived experience most retirement articles skip. A “safe” plan is not a plan that never falls. It is a plan that falls and adjusts before the fall becomes permanent. Guardrails do not prevent bear markets. They prevent bear markets from becoming irreversible when your withdrawal policy refuses to bend.
Rigid 5% is the cautionary column: 1.1% ruin at 4%, 4.6% at 5%, and a worst-case ending balance of just $22K in the bottom 5% of worlds. The median drawdown was actually no deeper than flexible 5% (50.9% vs 53%). The difference is not how far the portfolio fell. It is whether spending fell with it.
Social Security helps, but it does not fix rigidity
This household receives $2,000 per month from Social Security starting at 65. That is $24,000 a year of spending the portfolio does not have to fund, a meaningful buffer, and one many real plans rely on. It is also why the fixed $5,000 monthly profile looks deceptively manageable on paper: only $3,000 per month must come from the portfolio once Social Security kicks in.
Yet that profile still failed in 10.9% of worlds. Social Security is stable; the portfolio is not. When a crisis cluster arrives in the first five years of retirement, a fixed $3,000 monthly portfolio draw does not shrink because Social Security arrived on schedule. The guardrail policies, by contrast, can reduce the portfolio slice while keeping total household spending within a survivable band.
Flexible 4% ended with a median sustainable figure of $7,527/mo, while the fixed profile advertised a higher sustainable figure ($8,193/mo) and still ran out in more than one in ten lifetimes. The higher headline number bought a higher ruin rate. That trade is invisible in any calculator that projects a single path and assumes spending is independent of balance.
When the rule breaks
Three conditions push even flexible policies toward the edge. None of them show up in a back-of-the-envelope calculation.
Longevity beyond 90. We fixed the horizon at age 90. Extend it to 95 or 100, which is increasingly the right planning assumption for healthy 65-year-olds, and the survival rates compress. The 4% debate was originally about thirty years. A forty-year retirement is a different problem.
Inflation that persists. Our engine models regime-dependent inflation, but the withdrawal rules here are not fully inflation-indexed in the Guyton-Klinger tradition. A 1970s-style stagflation decade erodes real spending power even when the nominal balance looks stable. The 4% rule's inflation adjustment assumes you still have a portfolio to draw from.
A spending floor you cannot cross. Guardrails work because you can cut discretionary spending after a bad year. If your plan has a hard floor (mortgage, medical costs, dependent care), the flexible policies collapse toward the fixed-profile column. The question is not “is 4% safe?” It is “how much of your spending could bend without breaking your life?”
And if you are still accumulating, the withdrawal debate is premature. The more leveraged move at 40 is usually savings rate and time in market, topics where staying invested through volatility beats timing the market, as we showed in our forty-year S&P analysis.
What to do with this
Treat 4% as a coordinate on a frontier, not a verdict. The table above is one household; your savings rate, retirement age, allocation, and spending flexibility move your point. But the shape of the frontier is stable: flexible policies cluster on the safe side, fixed-need policies cluster on the ruin side, and the starting percentage mainly trades income for legacy within the safe cluster.
If you want one sentence: 4% with guardrails held up in every world we threw at it; 4% without flexibility did not. That is the honest answer to “is it still safe?” It is conditional on the policy you actually pair it with.
Bengen's research used historical U.S. return series and a fixed inflation-adjusted withdrawal. Our test uses a forward-looking regime generator with crisis clustering, a different environment but the same question: what fraction of plausible futures run out of money? Under that framing, 4% is not a universal constant. It is a policy choice that produced 0% ruin here and would produce a different number for a household that retires earlier, holds less equity, or cannot trim spending after a down year.
The worst 5% column is the one most retirement calculators omit. Flexible 4% still ended with $501K in those worlds. The fixed $5,000 profile ended with zero. If you are planning to the median, both look fine. If you are planning to the left tail, which is what “safe” is supposed to mean, only one of them is.
The practical checklist is short. Know your starting rate. Know whether your plan can cut spending when the portfolio rate breaches the upper guardrail. Know the difference between the income you want and the income that survives the bad sequences. Run those three against thousands of worlds, not one average path, and the headline percentage stops being a slogan and starts being a coordinate you can move. That is the difference between a rule and a plan.
Notes on the figures. Every number was computed from a live run of Killion's own simulation engine on one hypothetical household: age 40, $250,000 invested, an 80% stocks / 15% bonds / 5% cash allocation, $2,000/month net savings while working, retiring at 65 with $2,000/month Social Security, drawing the portfolio to age 90, across 5,000 simulations on the engine's regime-switching environment (seed 20260622). Flexible policies use the Guyton-Klinger guardrail agent (±20% rate band, 10% annual adjustment). Rigid policies use the same initial rate with adjustments disabled. “Money lasts” is the share of worlds that never hit zero; “safe spend” is the median inflation-adjusted monthly amount the portfolio could sustain to the horizon. All dollar figures are real, inflation-adjusted to the present. This article is educational analysis, not investment advice, and does not recommend any security or strategy.
References
- William Bengen, “Determining Withdrawal Rates Using Historical Data,” Journal of Financial Planning (1994): the original 4% rule.
- Jonathan Guyton and William Klinger, “Decision Rules and Maximum Initial Withdrawal Rates,” Journal of Financial Planning (2006): guardrails framework used in the flexible policies above.
- On sequence-of-returns risk in early retirement, see our strategy benchmark and the decumulation results for guardrails vs fixed spending.
- On why single-point projections mislead, see our Monte Carlo simulation article.